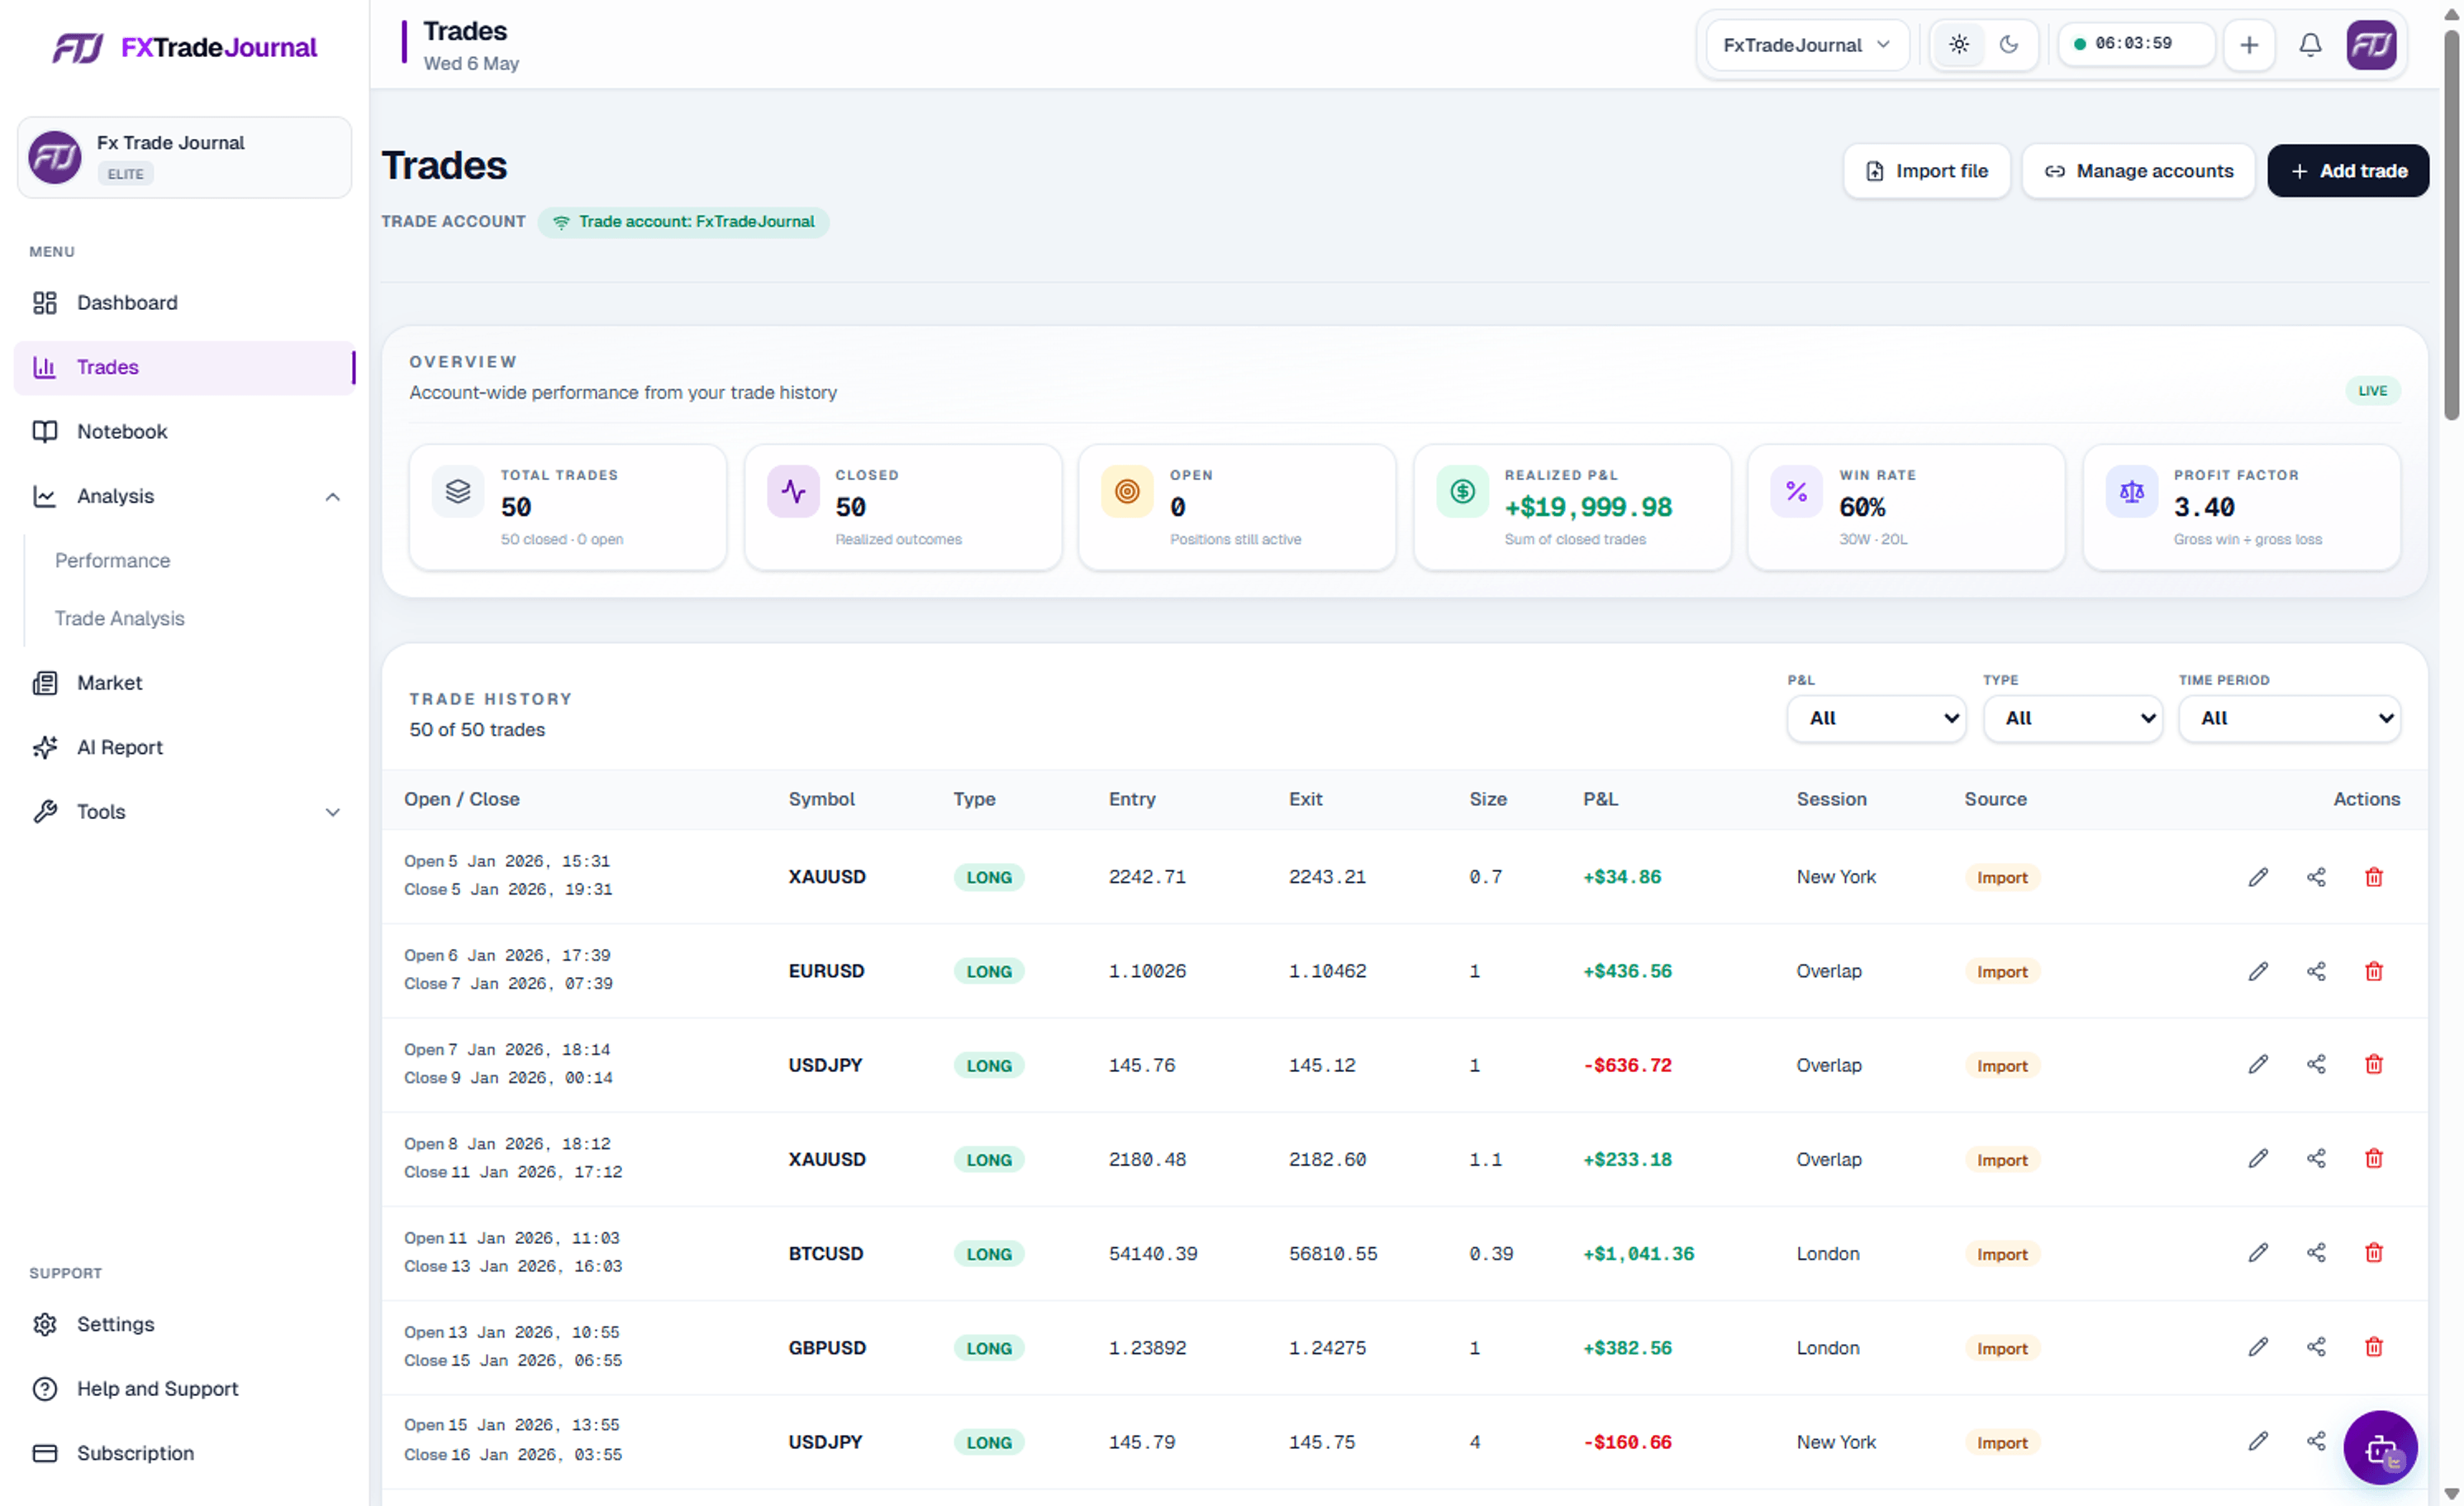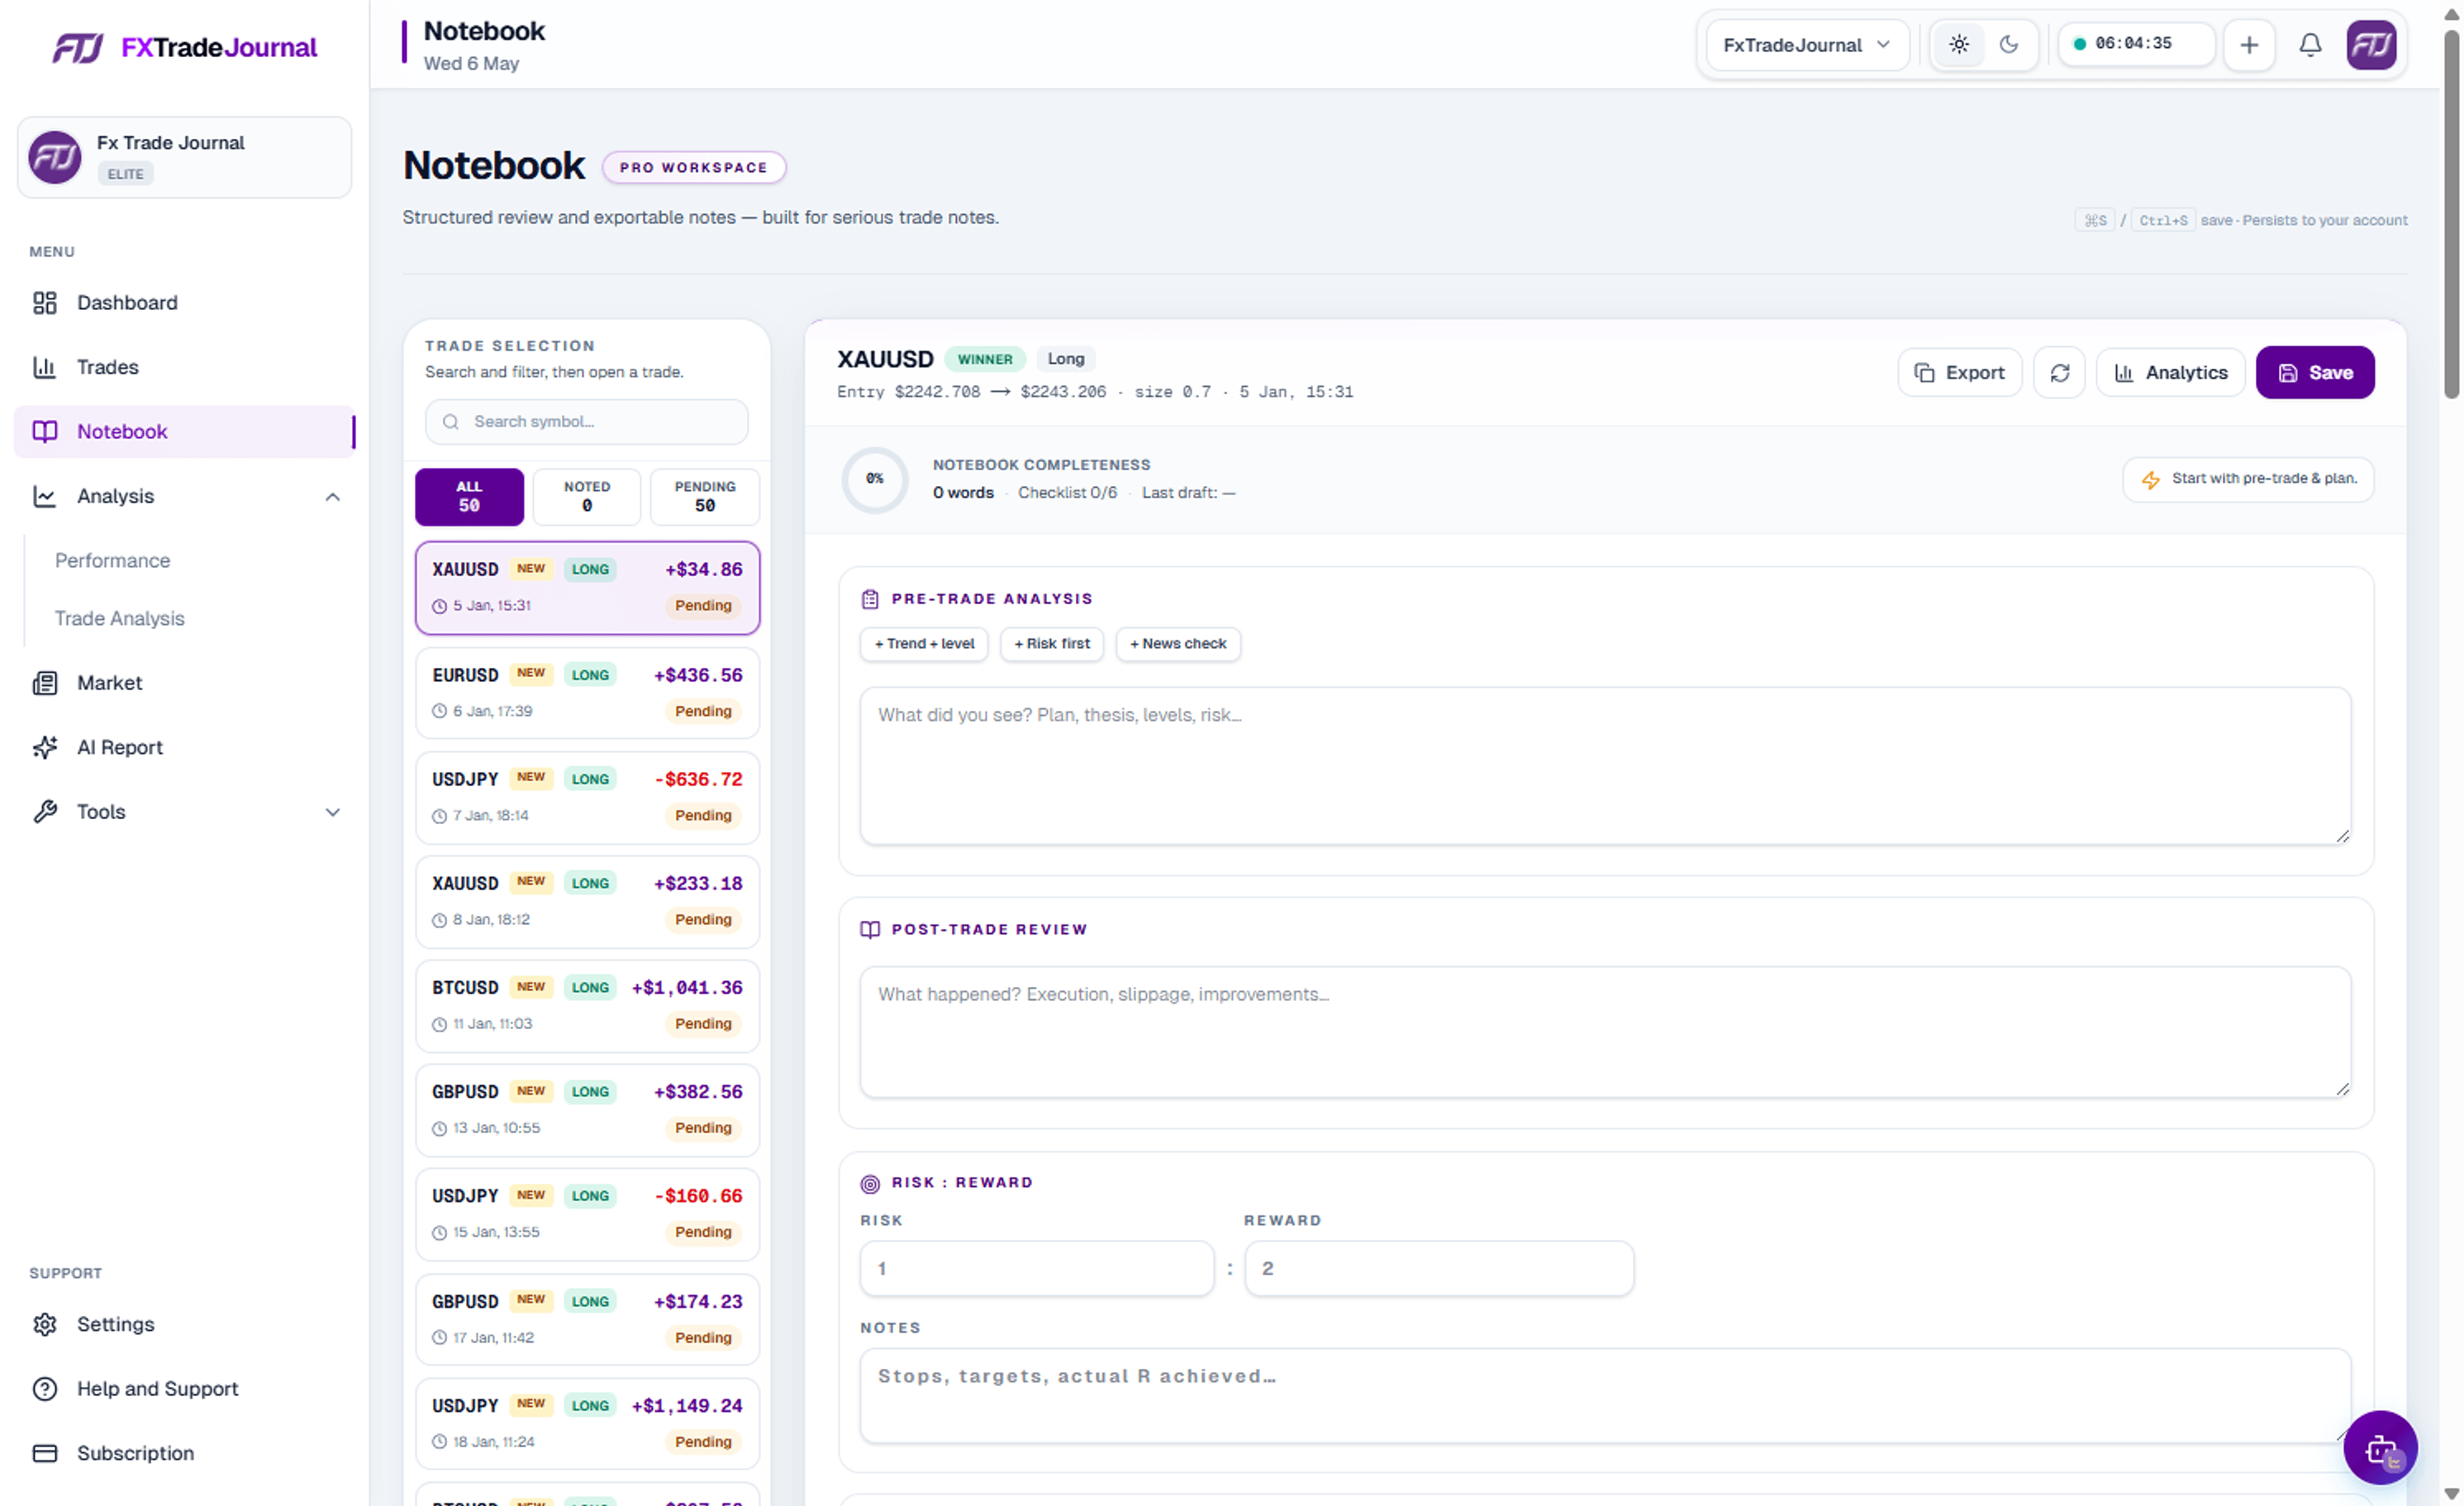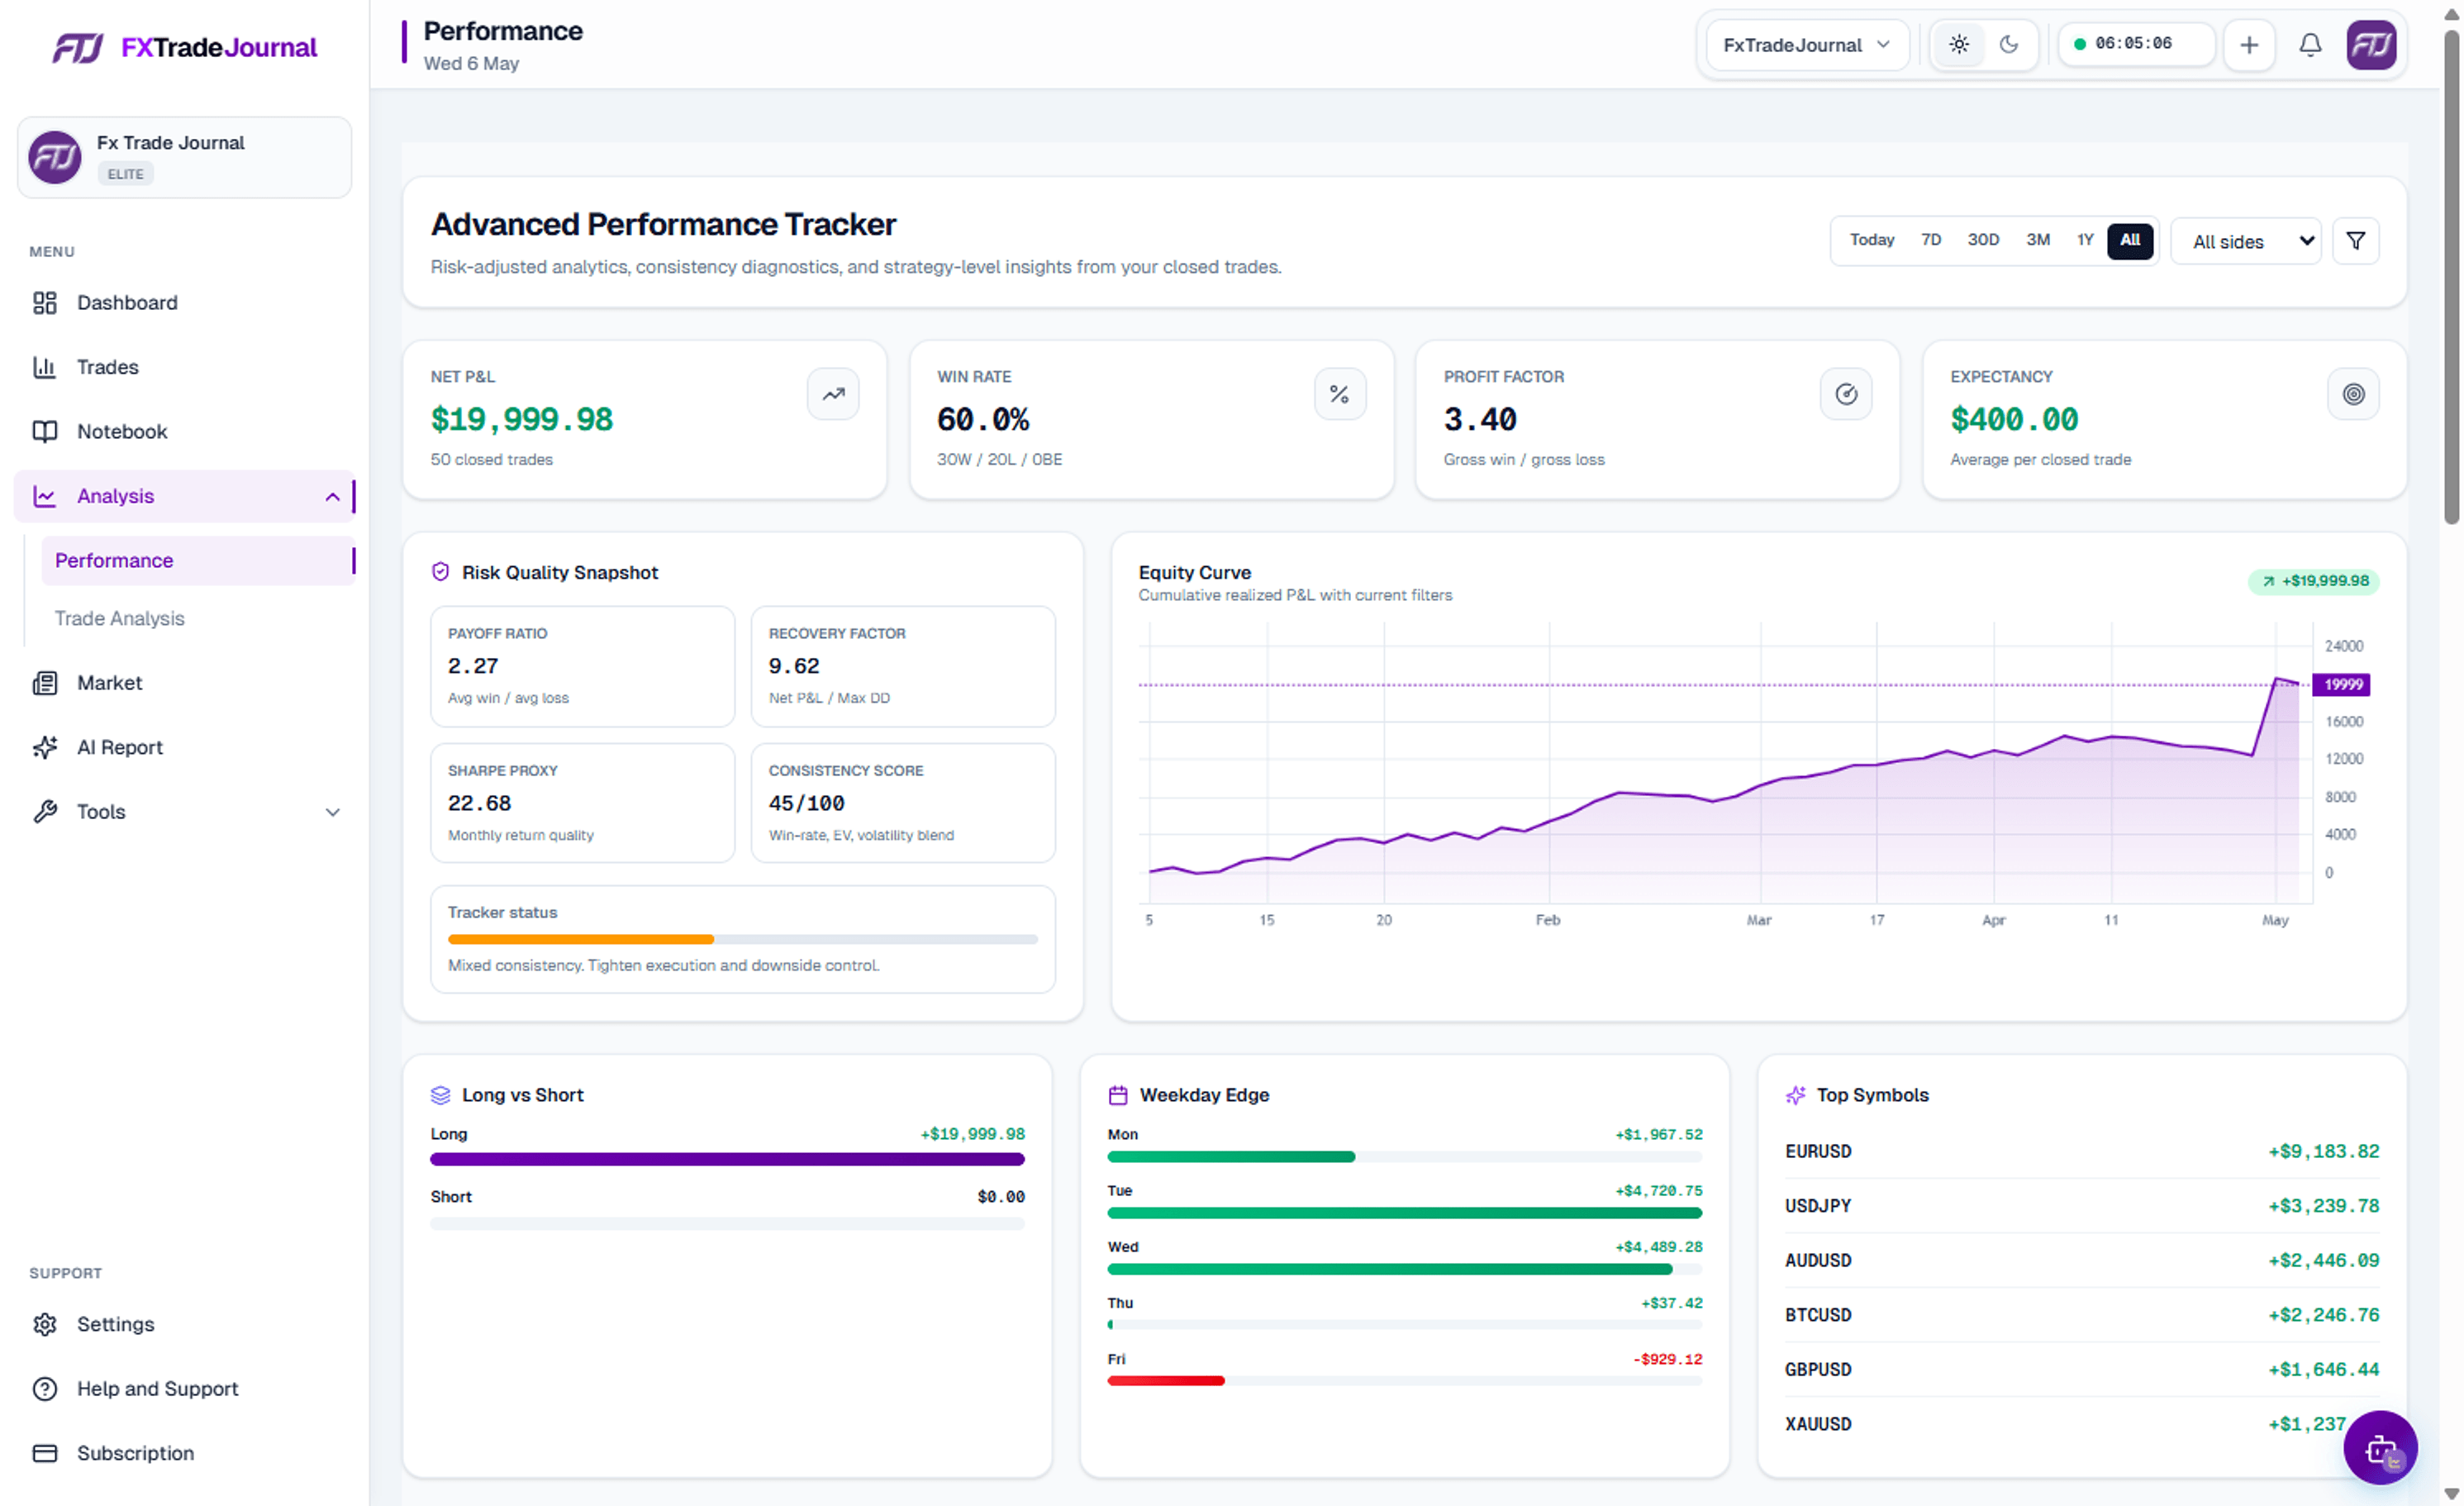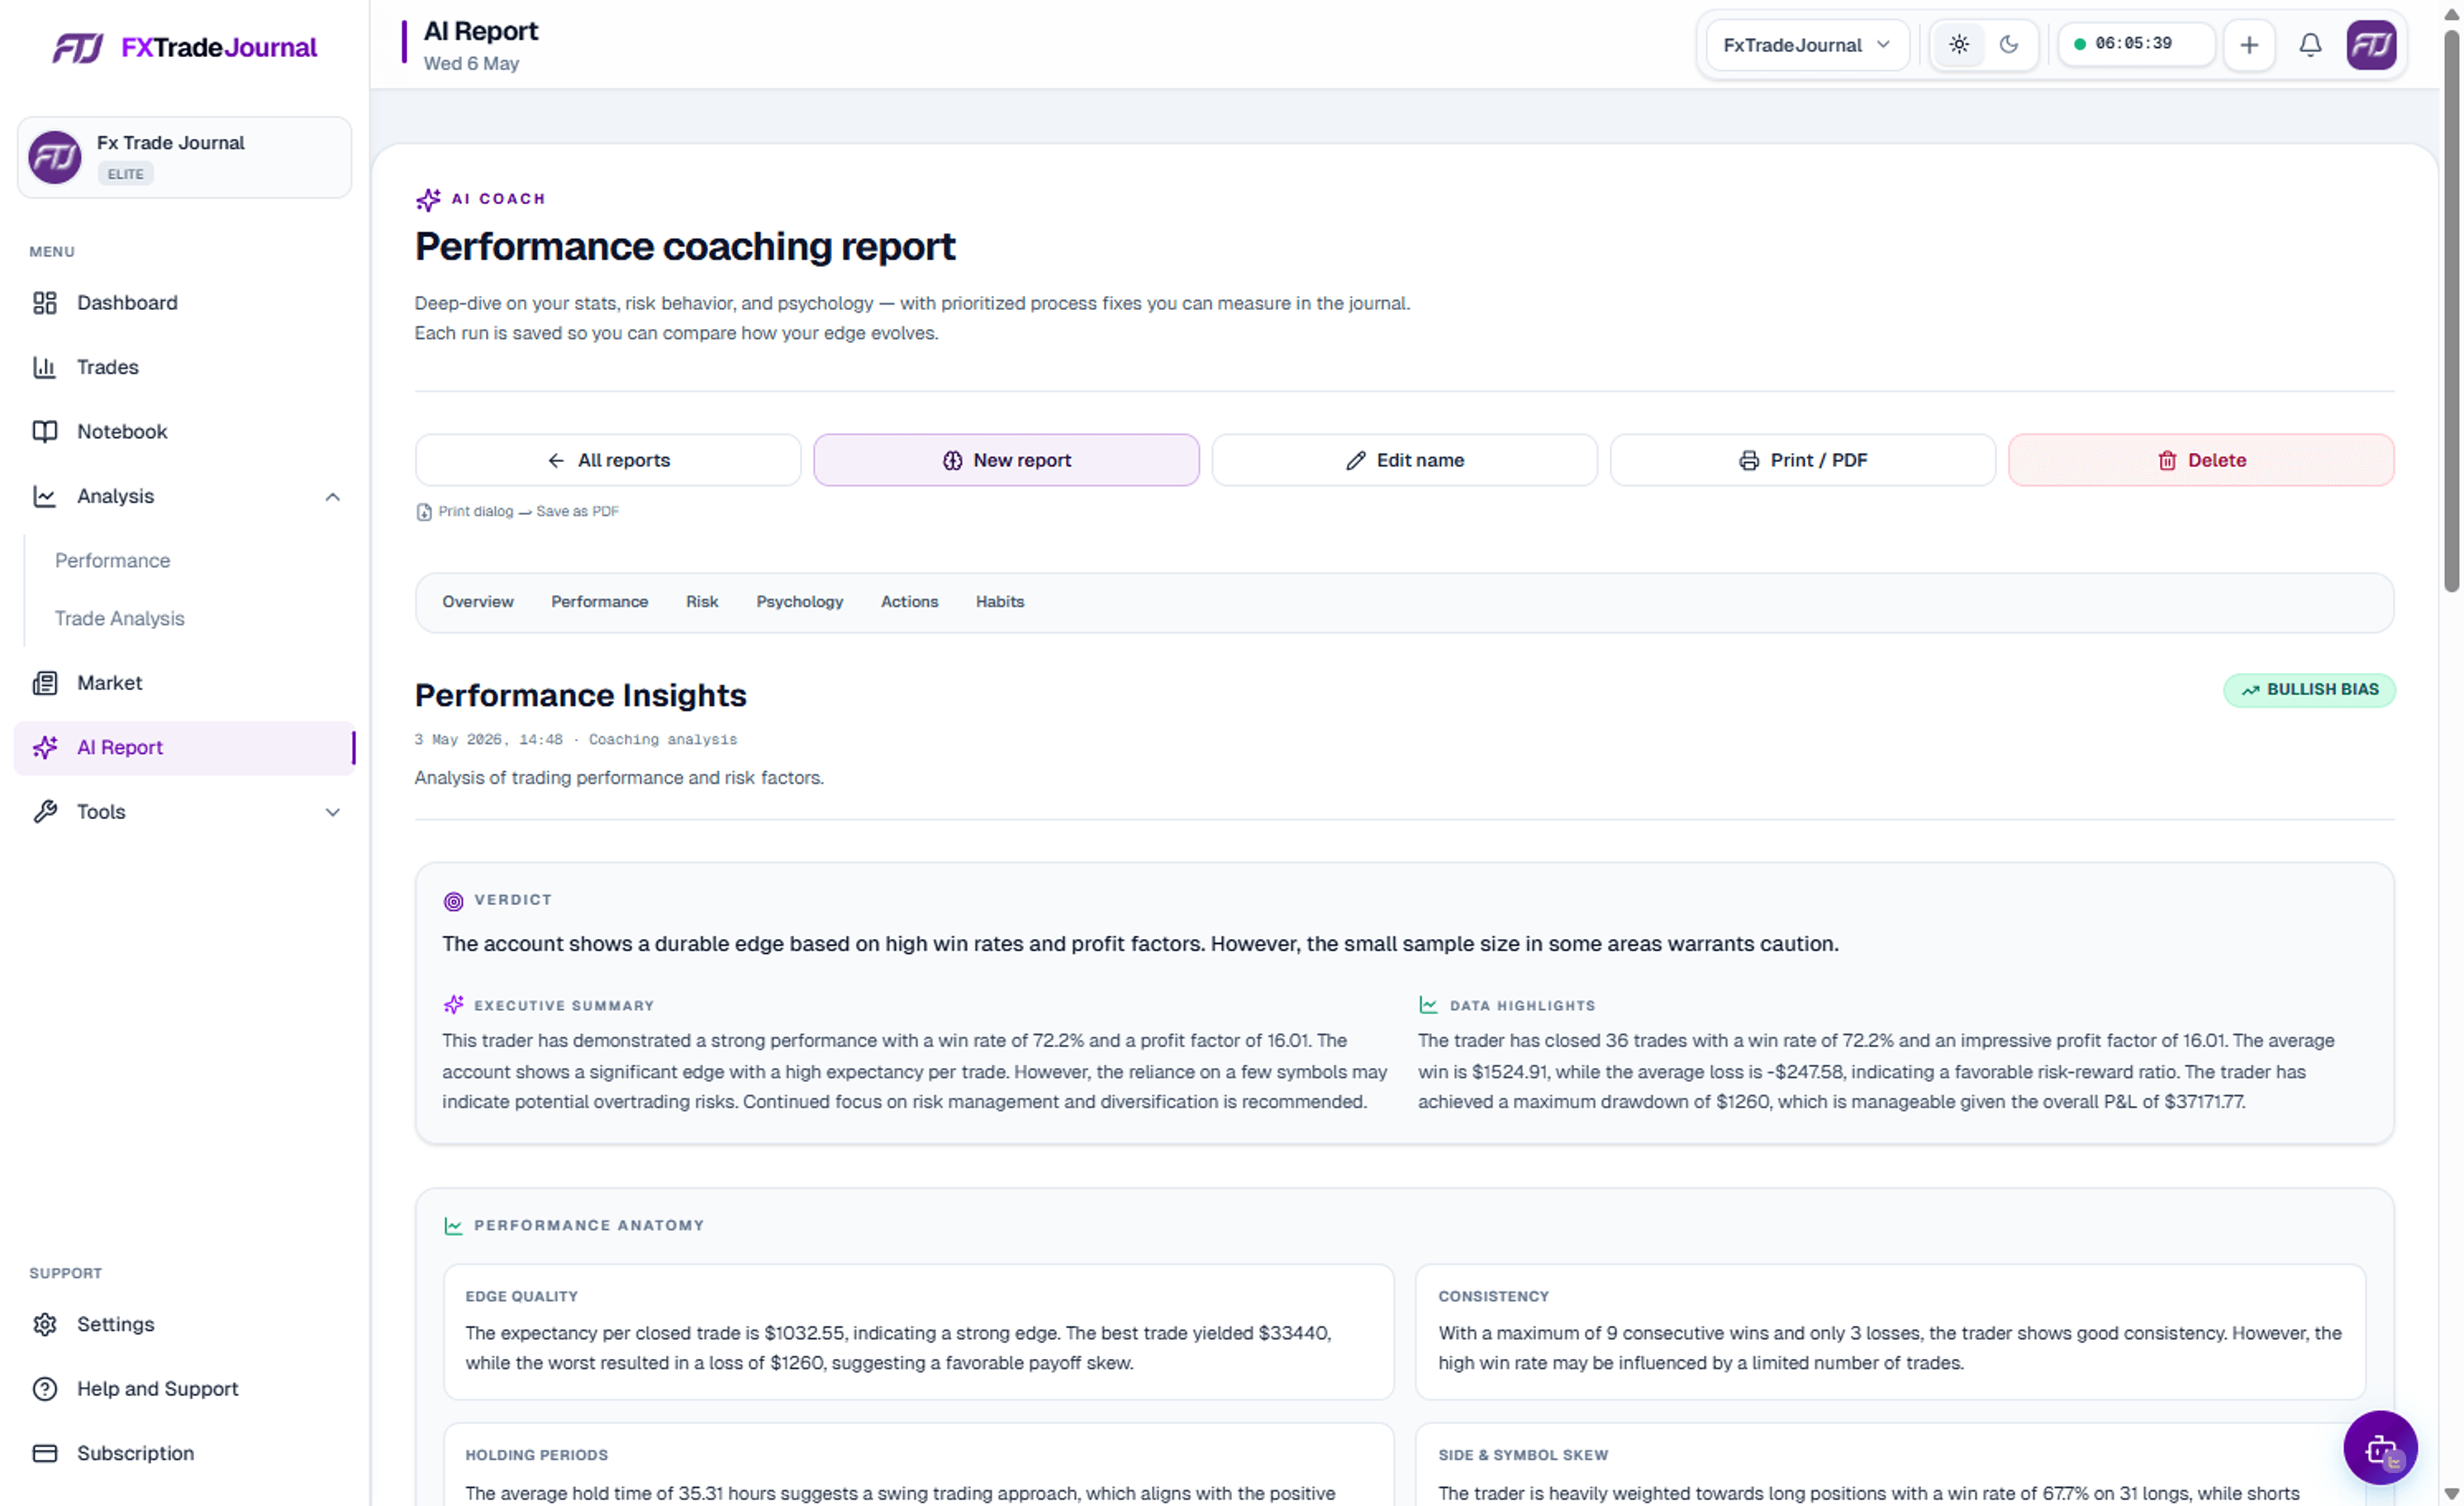
How the surfaces connect
FXTradeJournal is organized around a single loop: sync executions, annotate with context, review on a schedule, and adjust process before drift becomes drawdown. Each screen below covers one step in that loop, from the morning performance snapshot through weekly AI coaching.
Screens are not isolated demos—they share tags, filters, and time zones so a note in the journal appears beside the chart in trade analysis and rolls up into performance dashboards.
Planning and risk tools
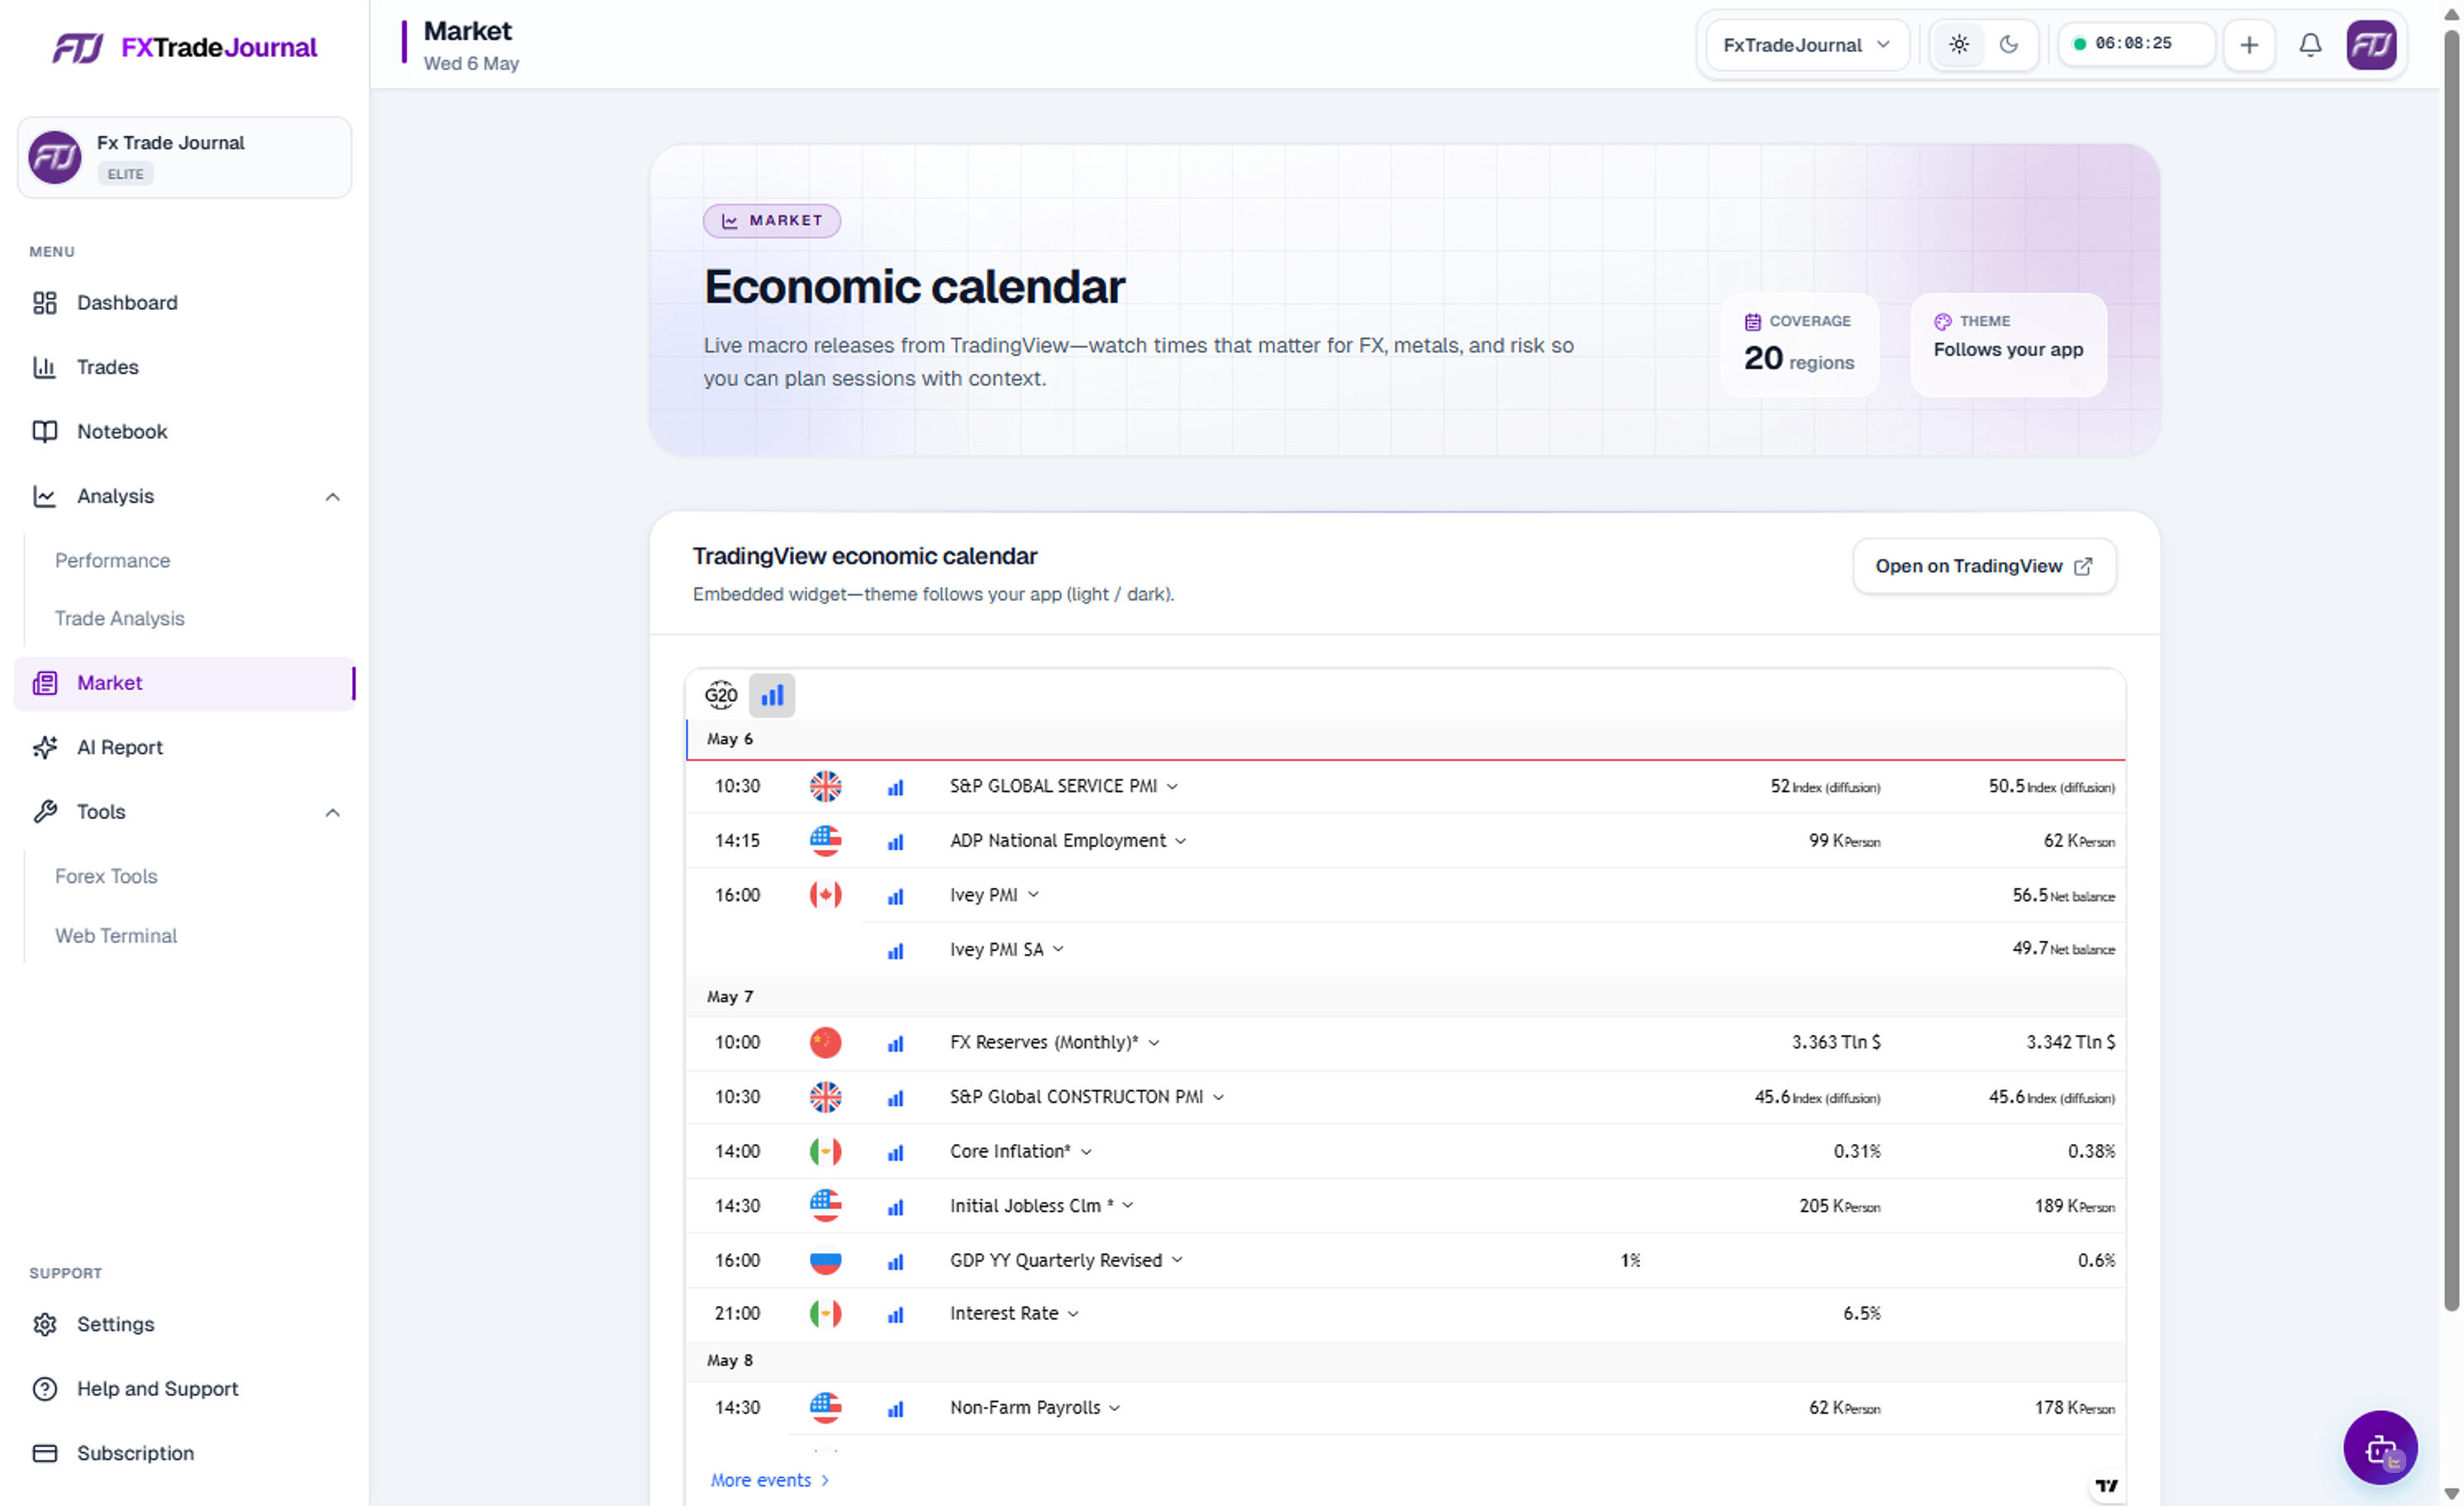
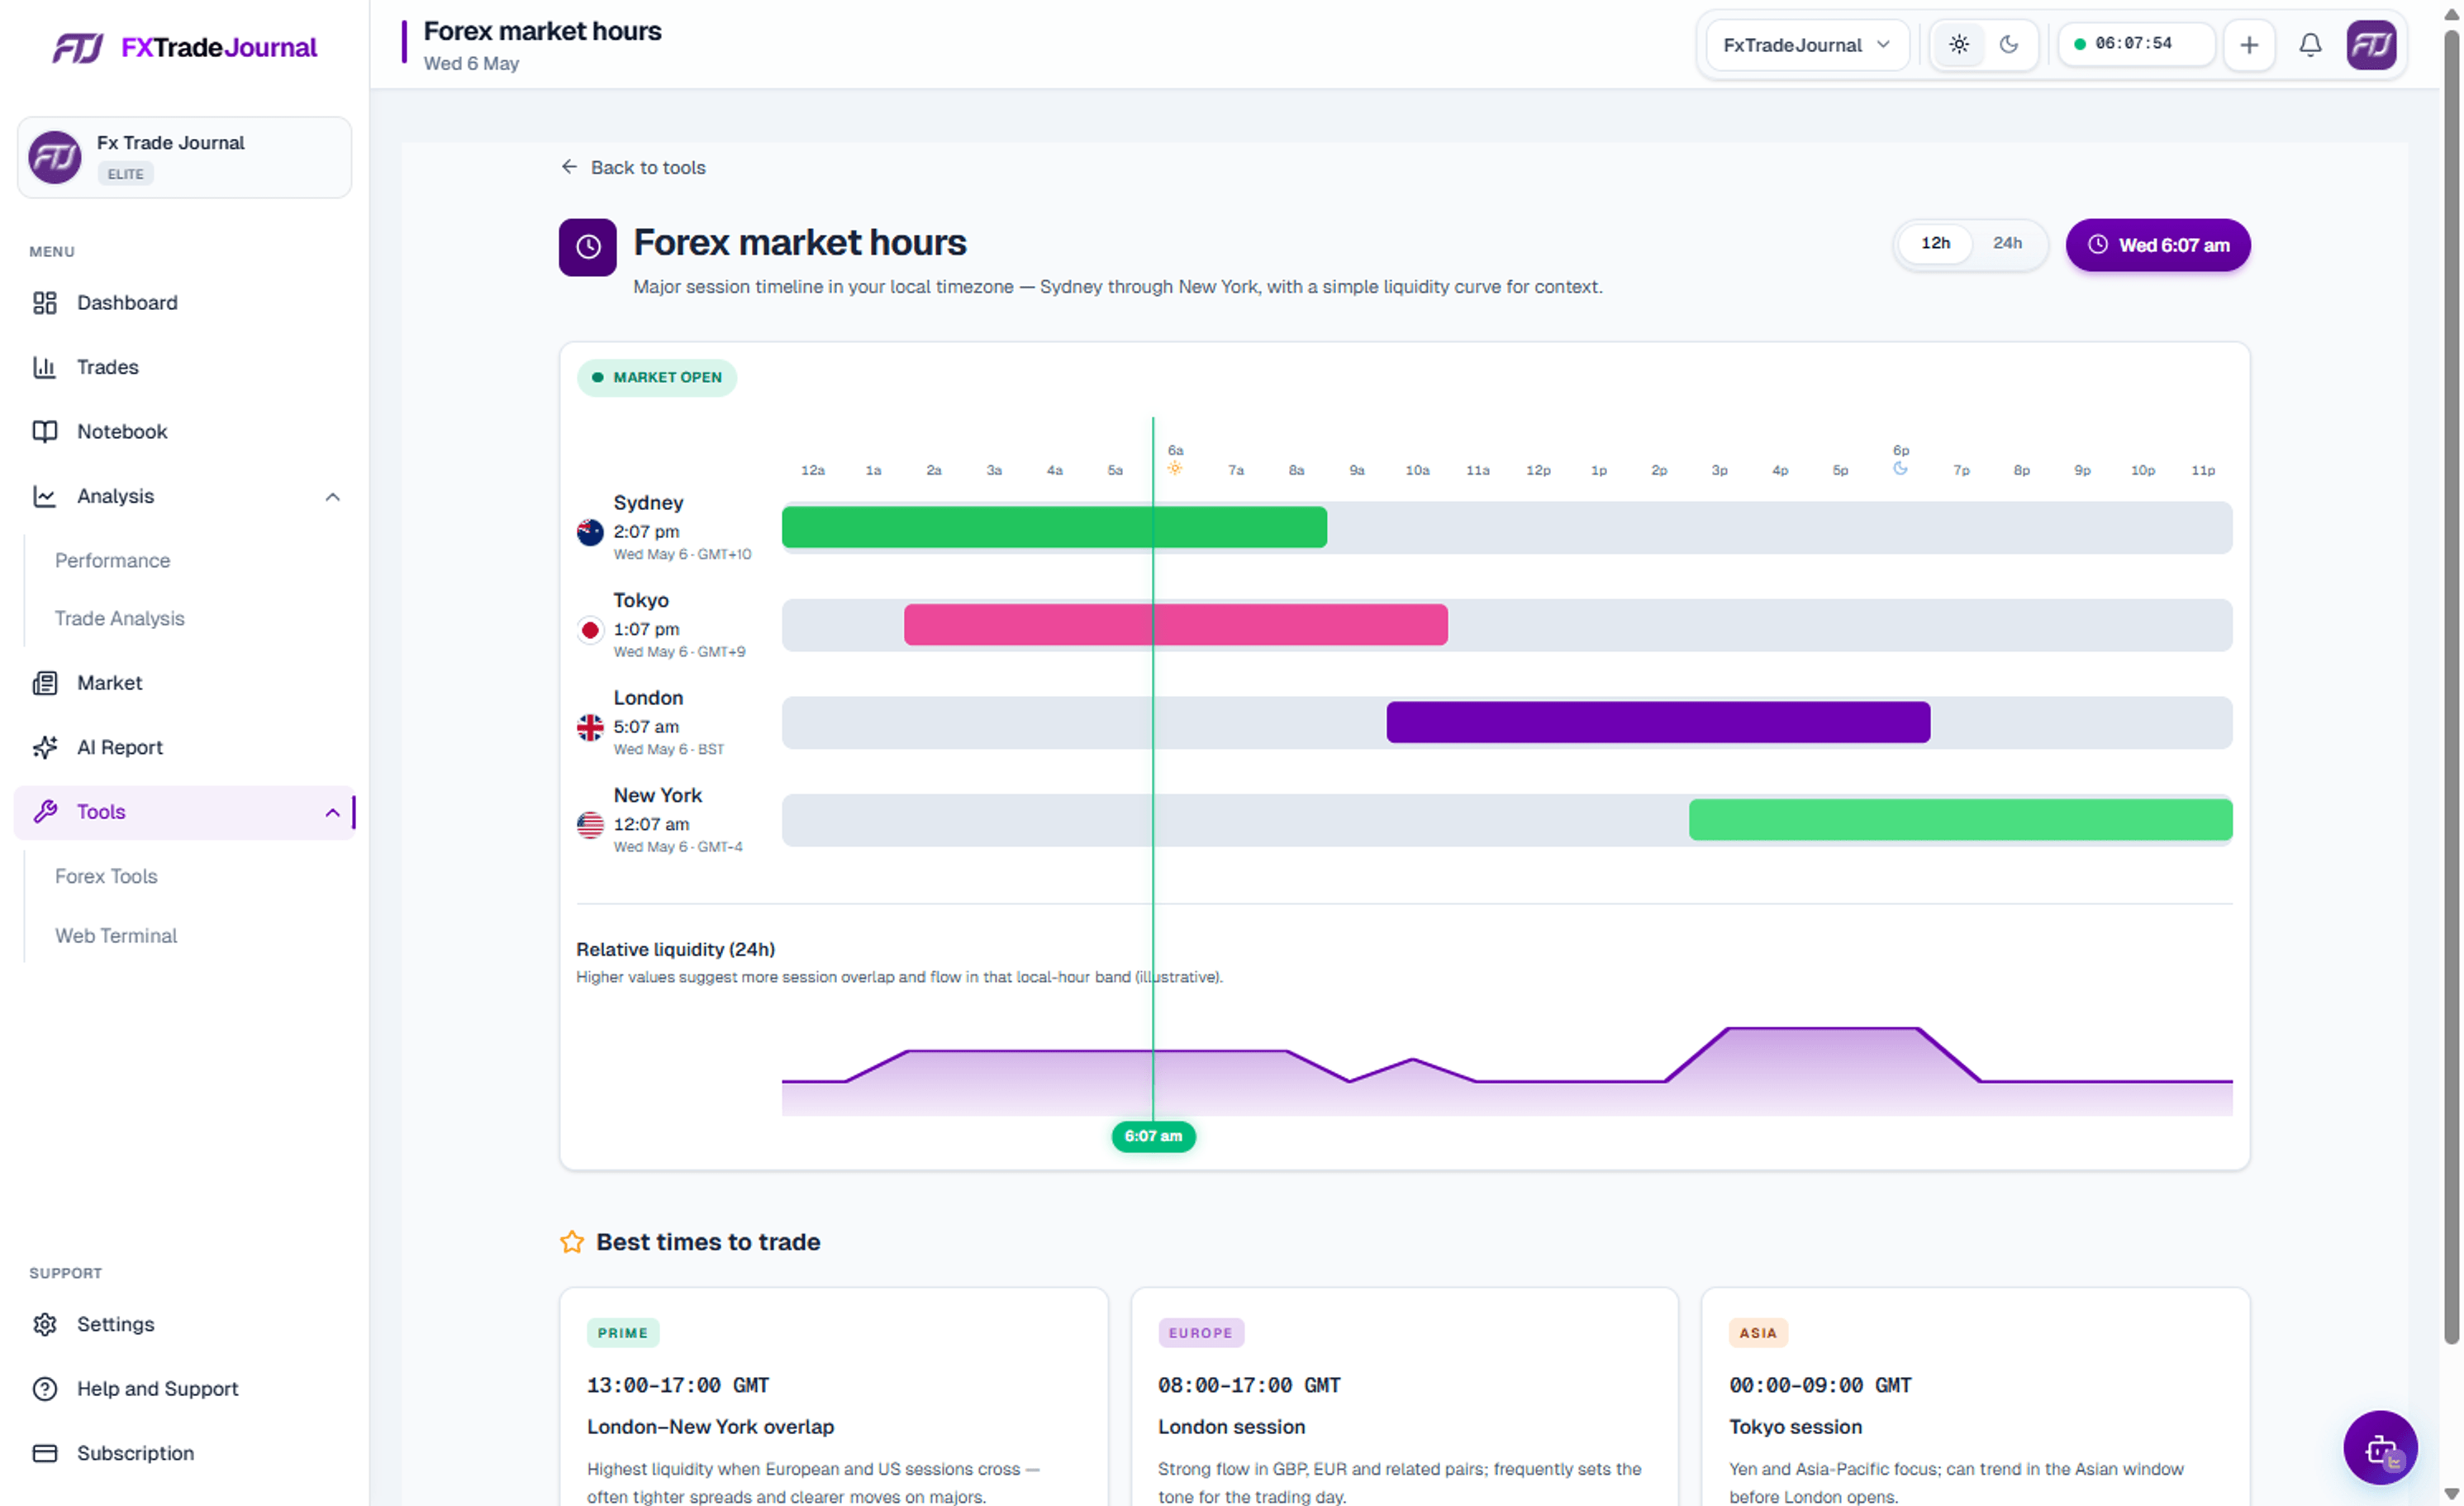
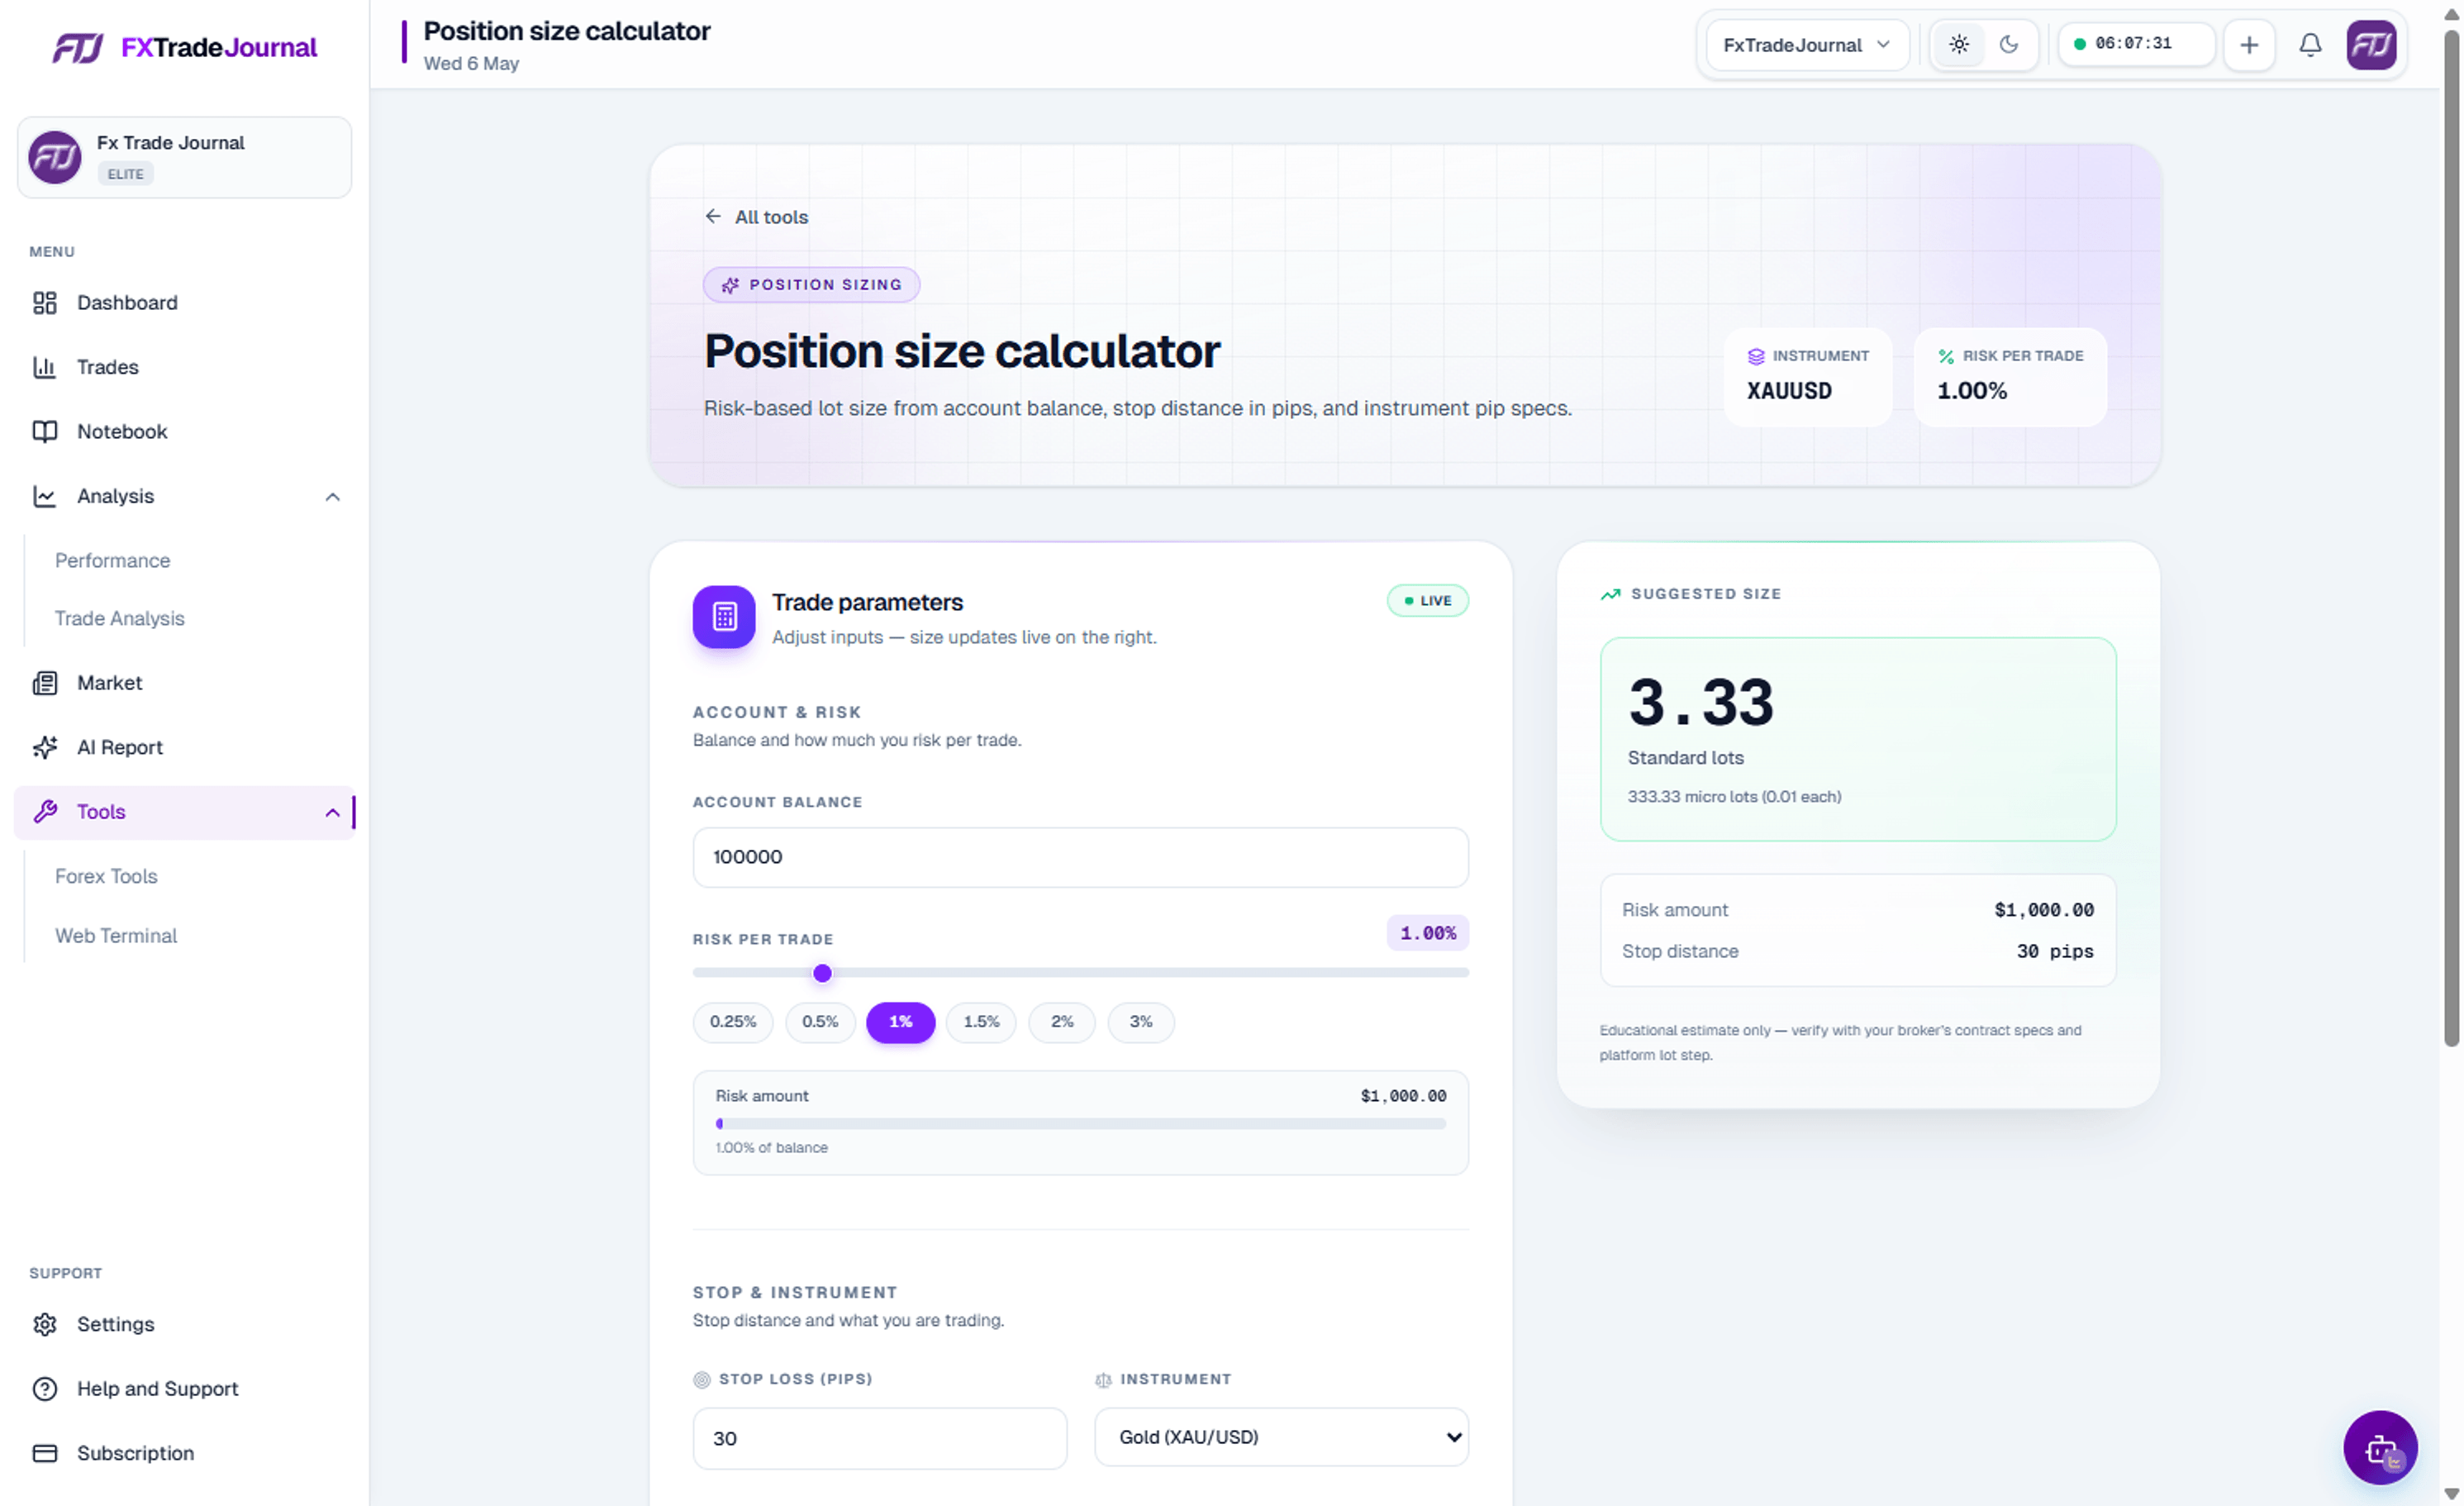
Economic calendar and market hours views filter macro catalysts and session overlap for the pairs you actually trade. The position size calculator translates account currency, pip value, and risk percentage into lot size before you click buy or sell on MT5.
Use these tools during prep, then return to the same workspace after the session to see whether execution matched the plan you documented.
Who should take the tour
New users should walk the tour after connecting MT5 so each surface maps to a step in their review ritual. Experienced traders often jump to trade analysis and performance dashboards first, then explore AI reports once a month of data exists.
Desk leads can share the tour during onboarding so every trader names the same screens in weekly meetings — reducing confusion when someone says journal versus trade analysis versus performance snapshot.